Sales Data Analysis

Utilizing Power BI, the data is analyzed, encompassing key sales metrics such as Product, Quantity, Price, and Time, allowing for insightful insights into sales trends and patterns.
Motivated and skilled Data Analyst and Web Developer with a Master’s degree in Information Technology. Strong mathematical skills enable me to analyze and interpret complex data effectively. Expertise in handling big data sets, advanced programming in Python, Power BI, Tableau, Excel, R, and SQL, with proficiency in data visualization tools and machine learning algorithms. Specialized in data science and the creation of chatbots utilizing Natural Language Processing (NLP) techniques. Additionally, experienced in web development using HTML, CSS, JavaScript, Bootstrap, Angular, and Ionic.
Utilizing Power BI, the data is analyzed, encompassing key sales metrics such as Product, Quantity, Price, and Time, allowing for insightful insights into sales trends and patterns.
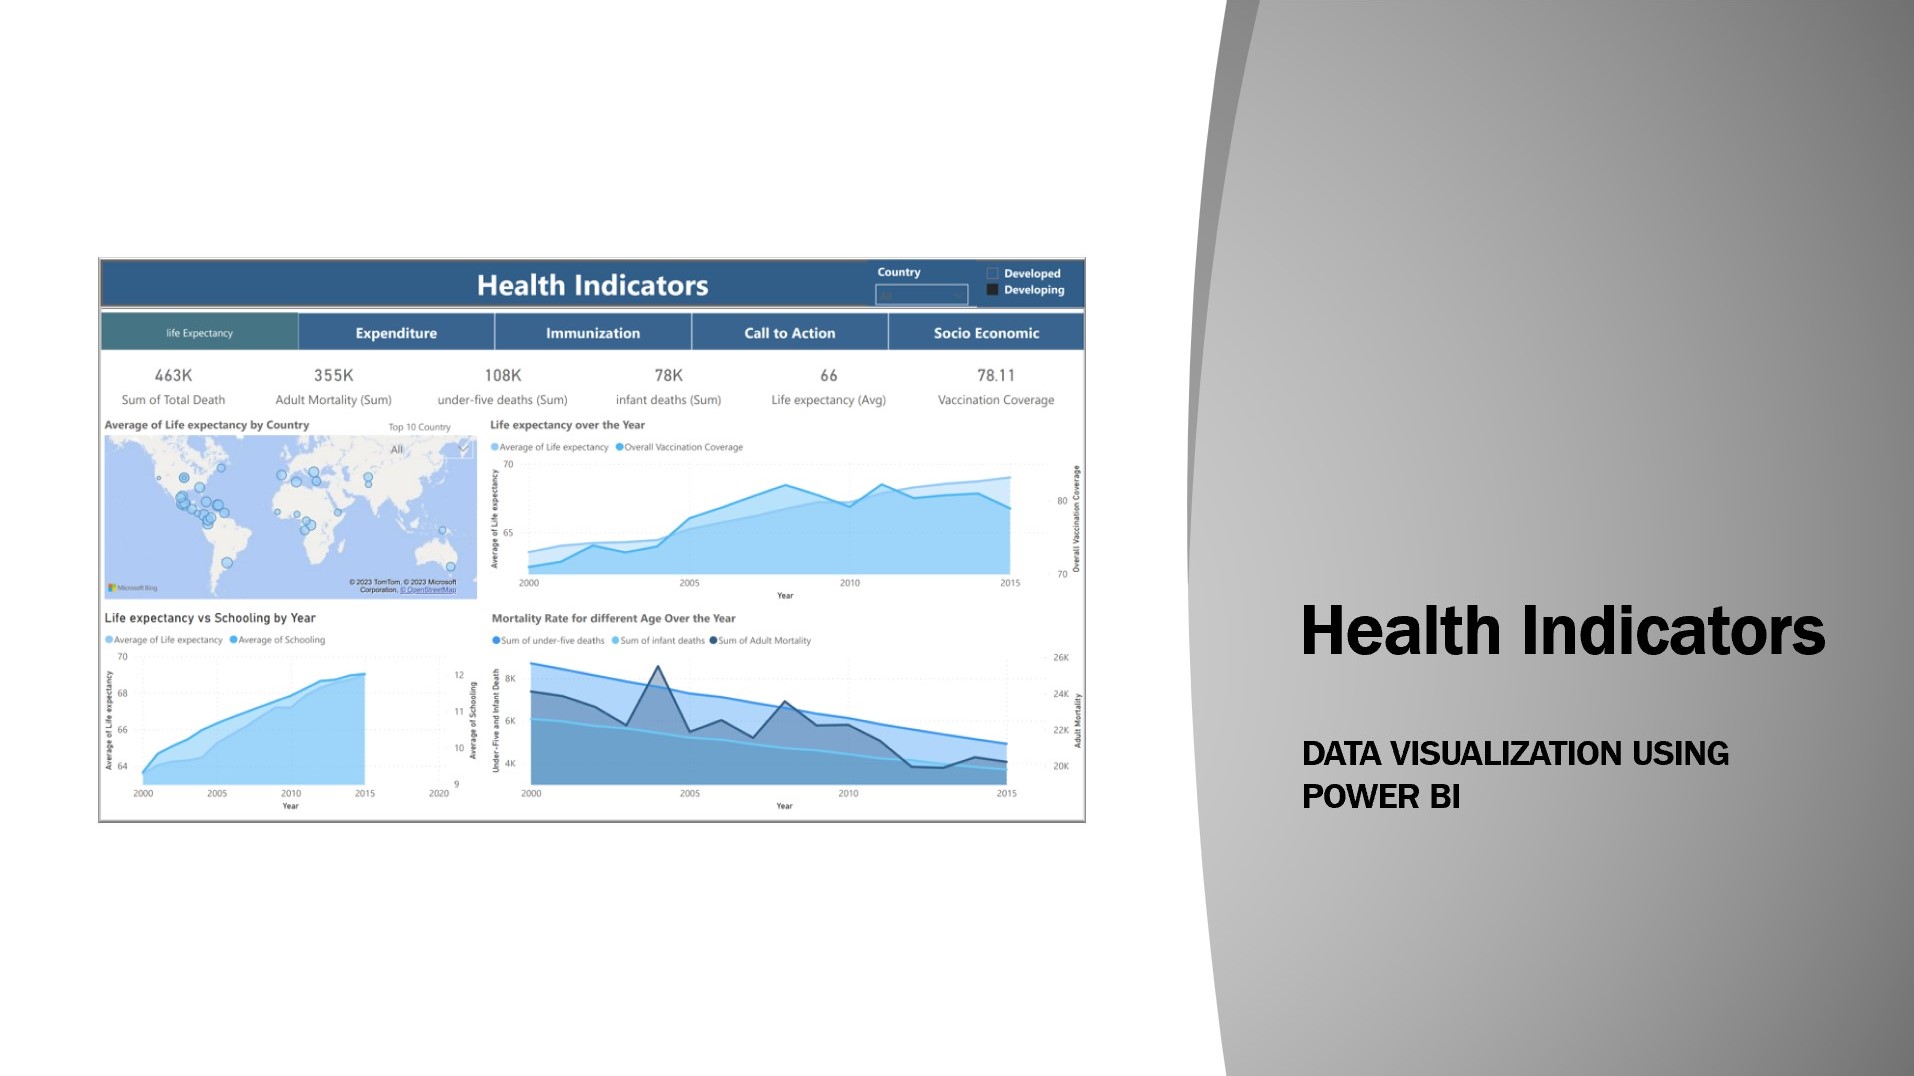
This analysis focus on developed nations with leading health indicators and balance health performance with economic expenditure.
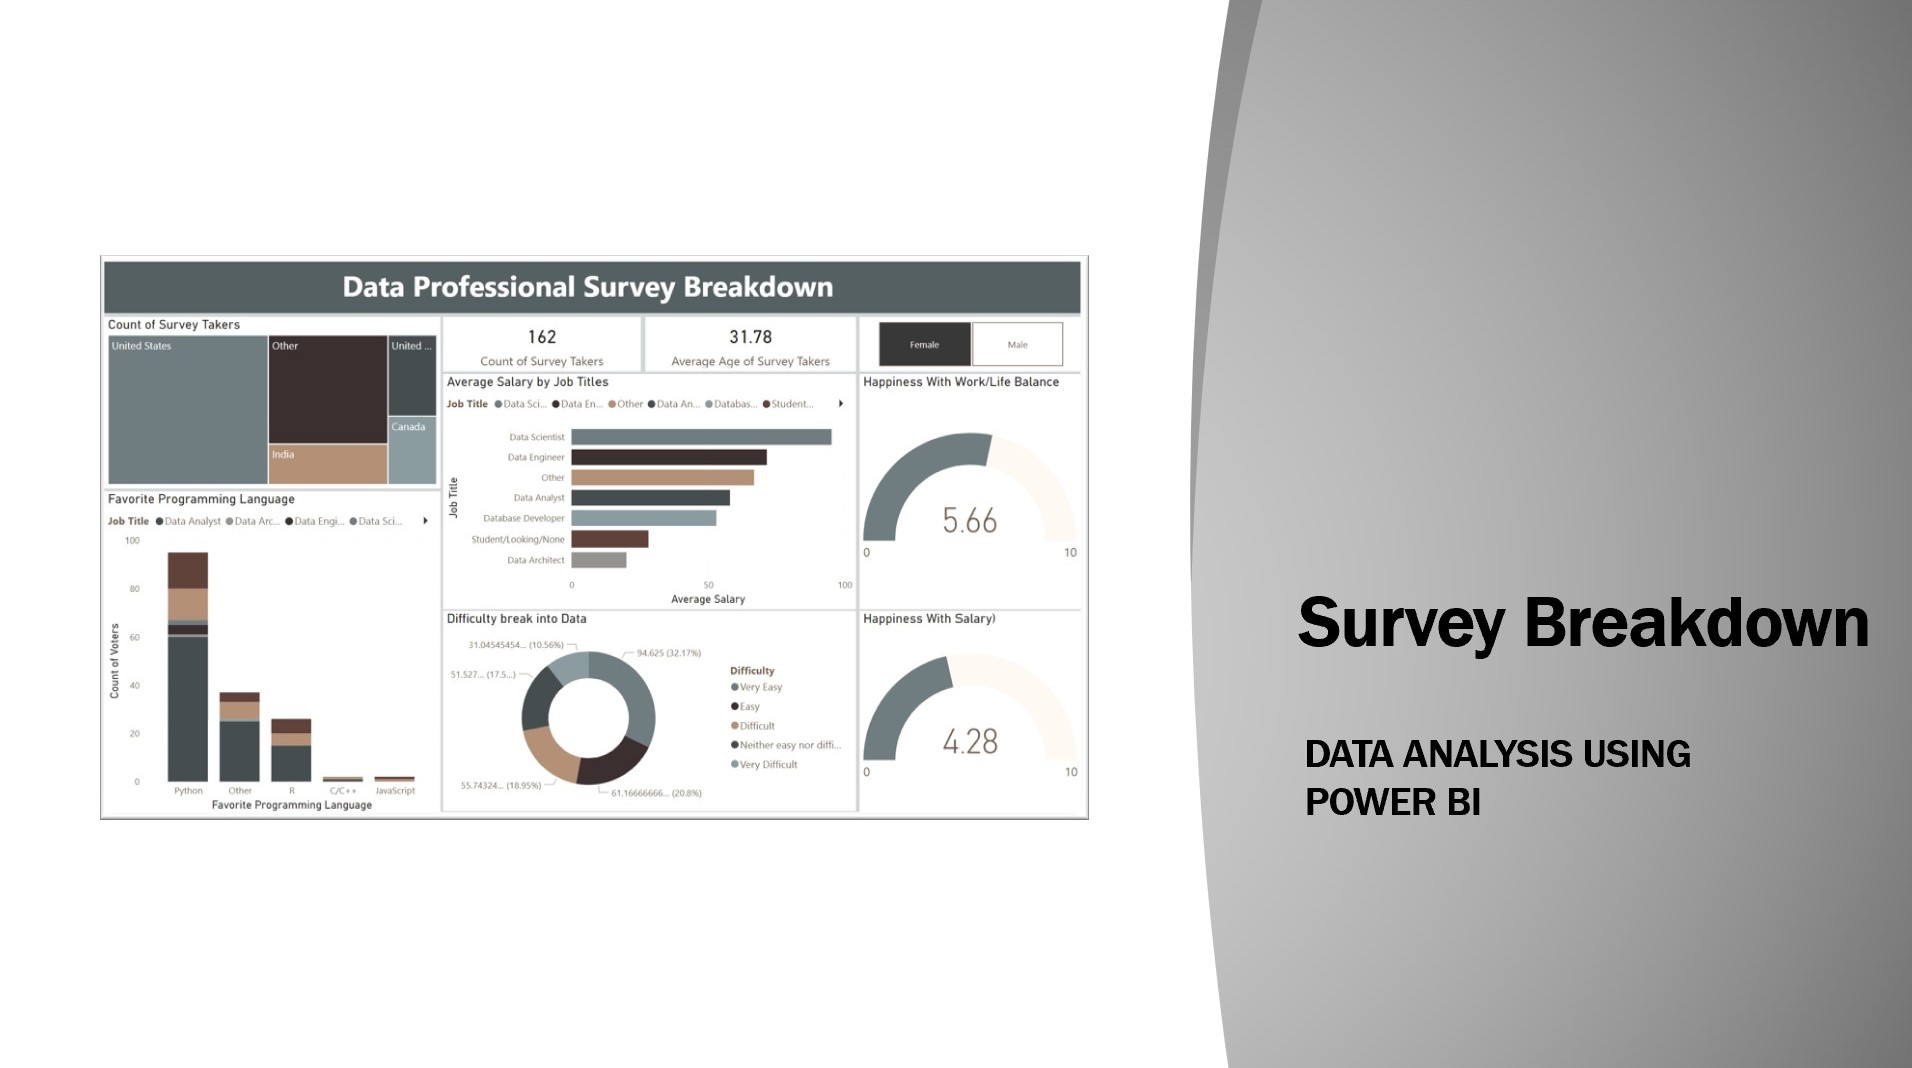
The Data Professional Survey Breakdown in Power BI presents an insightful analysis of survey metrics including programming language preferences, difficulty levels, salary satisfaction, and job title-based salary averages. With the ability to filter by gender, users gain a comprehensive understanding of the data and make informed decisions.
Canada
Alberta, Calgary
Proficiently utilized Power BI to transform raw data, perform data modeling, conduct DAX calculations, apply machine learning for predictions, utilize filters and slicers, and create insightful reports and dashboards, effectively communicating valuable information.
Utilizing Power BI, the data is analyzed, encompassing key sales metrics such as Product, Quantity, Price, and Time, allowing for insightful insights into sales trends and patterns.
This analysis focus on developed nations with leading health indicators and balance health performance with economic expenditure.
The Data Professional Survey Breakdown in Power BI presents an insightful analysis of survey metrics including programming language preferences, difficulty levels, salary satisfaction, and job title-based salary averages. With the ability to filter by gender, users gain a comprehensive understanding of the data and make informed decisions.
Canada
Alberta, Calgary